


Use Case 4: ETC with Myres Hill Private Wire
Case Overview
Esssentially this is a combination of the ETC bases case with the Myres Hill Case without a Battery. In this case it is assumed that a private wire (distribution connection) using overhead lines connects Myres Hill to ETC. The export limit on this line is assumed to be 250kW. In addition the case assumes:
- 10% Loss of Export Volumes via the private wire (assumption)
- Myres Hill wind output is sold on a fixed price PPA contract (to grid point B) that allows for volumes to be diverted to ETC
Assets
- 10 kW Wind Turbine @ETC
- 12 kW Solar PV @ETC
- 100 kW 178 kWh Battery -ETC
- Load 10-60 kW @ETC
- 3 turbines with a combined peak output of 2.025 MW @Myres Hill
- Private Wire Link (250kW)
- MPC Control
Market
Usecase 4 assumes that the ETC sells any exports on an octopus agile outgoing tariff. Imports are charged at the Octopus agile Tariff. The Myres Hill wind turbine are assumed to sell at grid point B at a fixed PPa price of £110/MWh. Click here for more details on the octopus tariff
Control and Data Capture
Usecase 4 uses MPC control to maximise net revenues i.e. Exports revenues - Import Revenues. The MPC control algorithm would use forecasts of demand and weather to formulate future renewables output/ demand at the site. These forecasts when combined with future octopus prices are used in an optimizer (Model Predictve Control - MPC), to estimate the actions required at the site to maximise future revenues. These actions are sent to the various assets. Measurements are fed back (along with the next set of weather,demand and price forecasts) and are used to estimate the next period's actions.
Animation
The video below conceptualises the current setup in block form and shows a simulation/animation of the assets described above. Arrow sizes represent flows associated with use case. Power flows are rounded to the nearest integer. Note this is an hypotetctcal example for demonstration. the sites do not have a private wire between them. - However it is based on real data from the sites.
Notes
- Net Revenues = Export to grid - Import from Grid Revenues
- Simulation over one week; Half Hour by Half Hour. Sim start from HH - 1
- Graphs show rolling window. Note the right hand side of the graph shows the latest output. Those to the left of that point represent the historical points
- Note zero flow lines still shown
- To ease understanding the Myres Hill (MH) flows have been scaled to a maximum flow of 2 MW. The ETC flows (including those flows from MH) are scaled to a maximum of 100kw. Therefore lines of the same size in MH vs ETC represnt differnt volumes.
- It is asumed that the MH contract would allow them to send volumes to ETC and later sell this via the Battery. In practice this may not be the case
Commentary
Essentially this case study is a "game of two halves". In the first half (early periods of the Sim), the VPP simulation/decision making unit uses Myres Hill (MH) Wind output to meet the need of the load. ETC renewables output is insufficient to meet the needs of the load. The battery is also used to meet this load at times. Note that rather than storing the Myres Hill (MH) output into the battery for later load use or exports, the MPC decision algorithm imports power from the Grid into the Battery. It typically does this when prices are very low or negative as expected but not always. Note it doesnt do this on all occasions, becasue the MPC algorithm is looking ahead 96 half hours and looks for the best time to store and dispatch the battery. Different price input patterns would result in different dispatch patterns. Export prices are lower than in later periods and are not enough to remunerate the loss of income from charging and then dispatching the battery (Arbitrage).
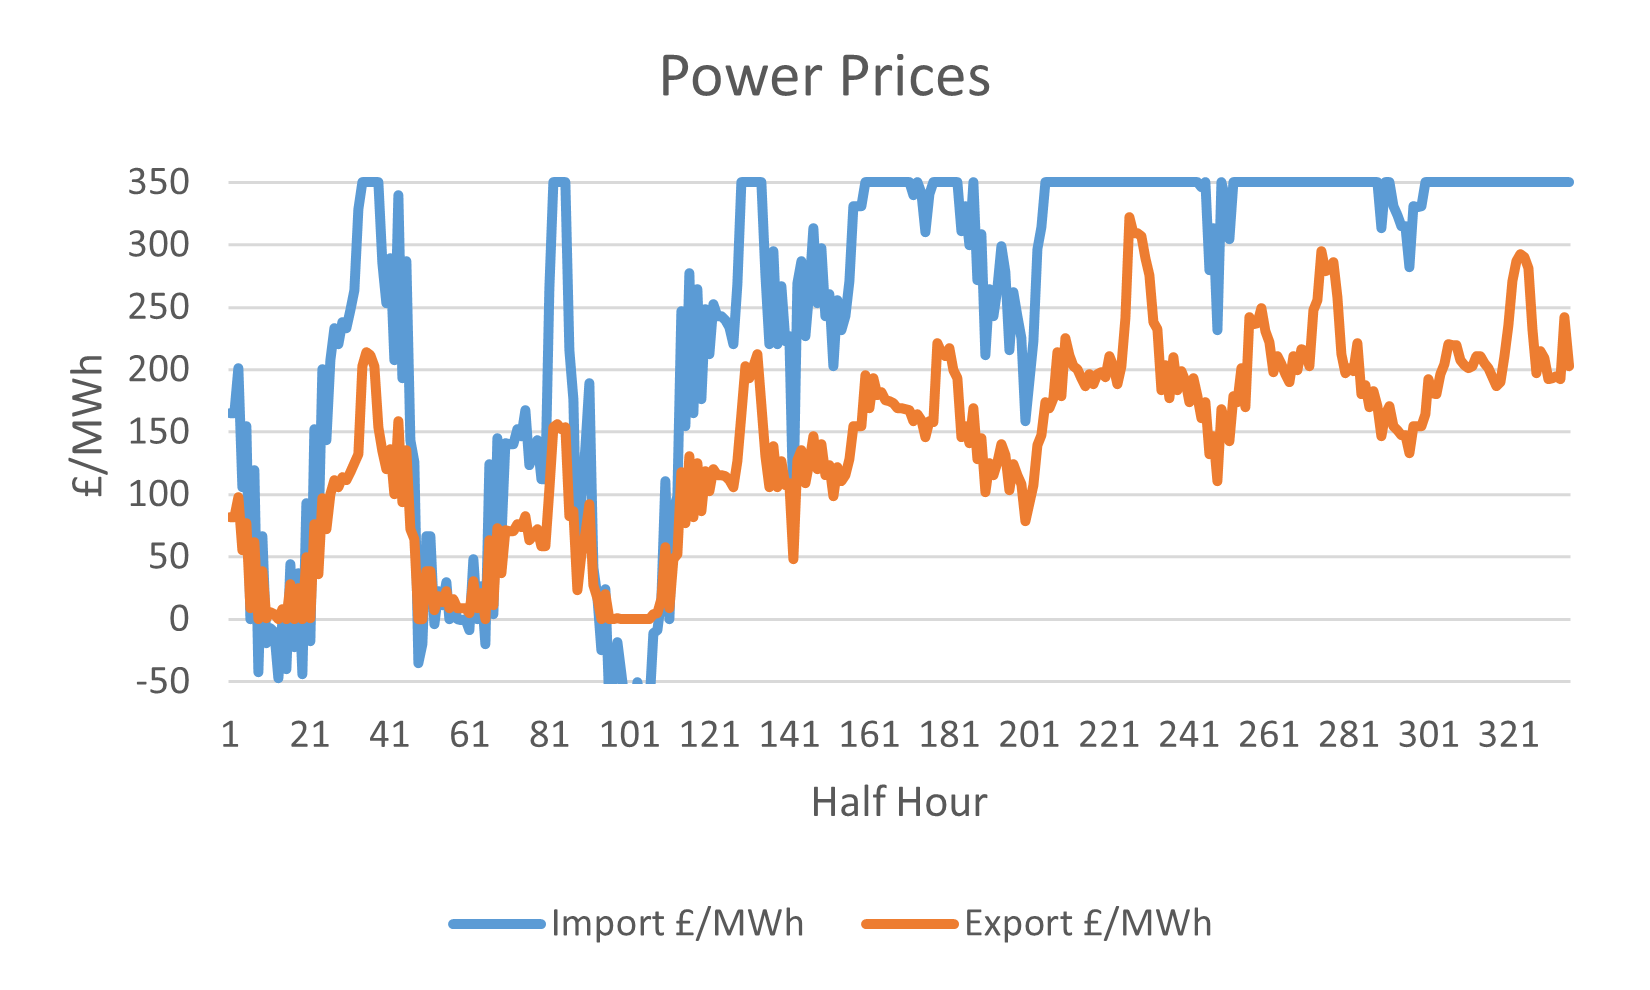
In later periods in the simulation prices are much higher and fewer instances of negative prices occur for imports (see Figure 3)
In this case Imports at ETC into the battery make no sense from a commercial point of view, so Imports to charge the battery start occuring via the MH private wire. In addition arbitrage opportunities exist
when ETC export prices are high (assuming exports were allowed). Becasue of losses in the private wire and loss in revenues from selling to grid point B at Myres Hill whilst charging, MH can always make additonal profit if it sells at circa 2.5 times
its fixed PPA price. This occurs in about 5% of the Half Hours in the case study presented.
Additional Revenues associated with the lower and sometimes negative Octopus price regime in the earlier time period results in additional revenues of £106 over approximatley half a week. This is associated with the savings from
using Myres Hill (MH) private wire volumes for Load support rather than importing at higher costs. In the second half of the simulation an additional £341 is
generated from MH/ETC contract arbitrage using ETC battery storage. These additonal revenues therefore could create £20-25,000 of additonal revenue. Note these calculations were based on Octopus 2022 prices. With higher export prices this revenue potential could potentially double. Of course this would be offset by costs associated with the Private Wire.