Use Case 3: ETC Site With Battery
Case Overview
The Engineering Technology Centre (ETC) based at East Kilbride in Scotland is providing the project a demonstrator site with a variety of assets including PV, Wind, a battery and Load. Imports occur at fixed prices but in this use case study, Octopus Agile Prices (Dynamic Tariffs) are used.
Assets
- 10 kW Wind Turbine
- 12 kW Solar PV
- 100 kW 178 kWh Battery -> Min SOC - 36 kWh
- MPC Control
- Load 10-60 kW
Market
Usecase 3 assumes that ETC sells to it flexibility/power on an octopus agile tariff. Click here for more details on the tariff.
Control and Data Capture
Usecase 3 assumes the use of Model Predictive Control (MPC). A look ahead function uses future prices and determines whether or not to export wind/PV output or store into a battery. At the appropriate times the battery is dischared to maximise revenues to the site.
Animation
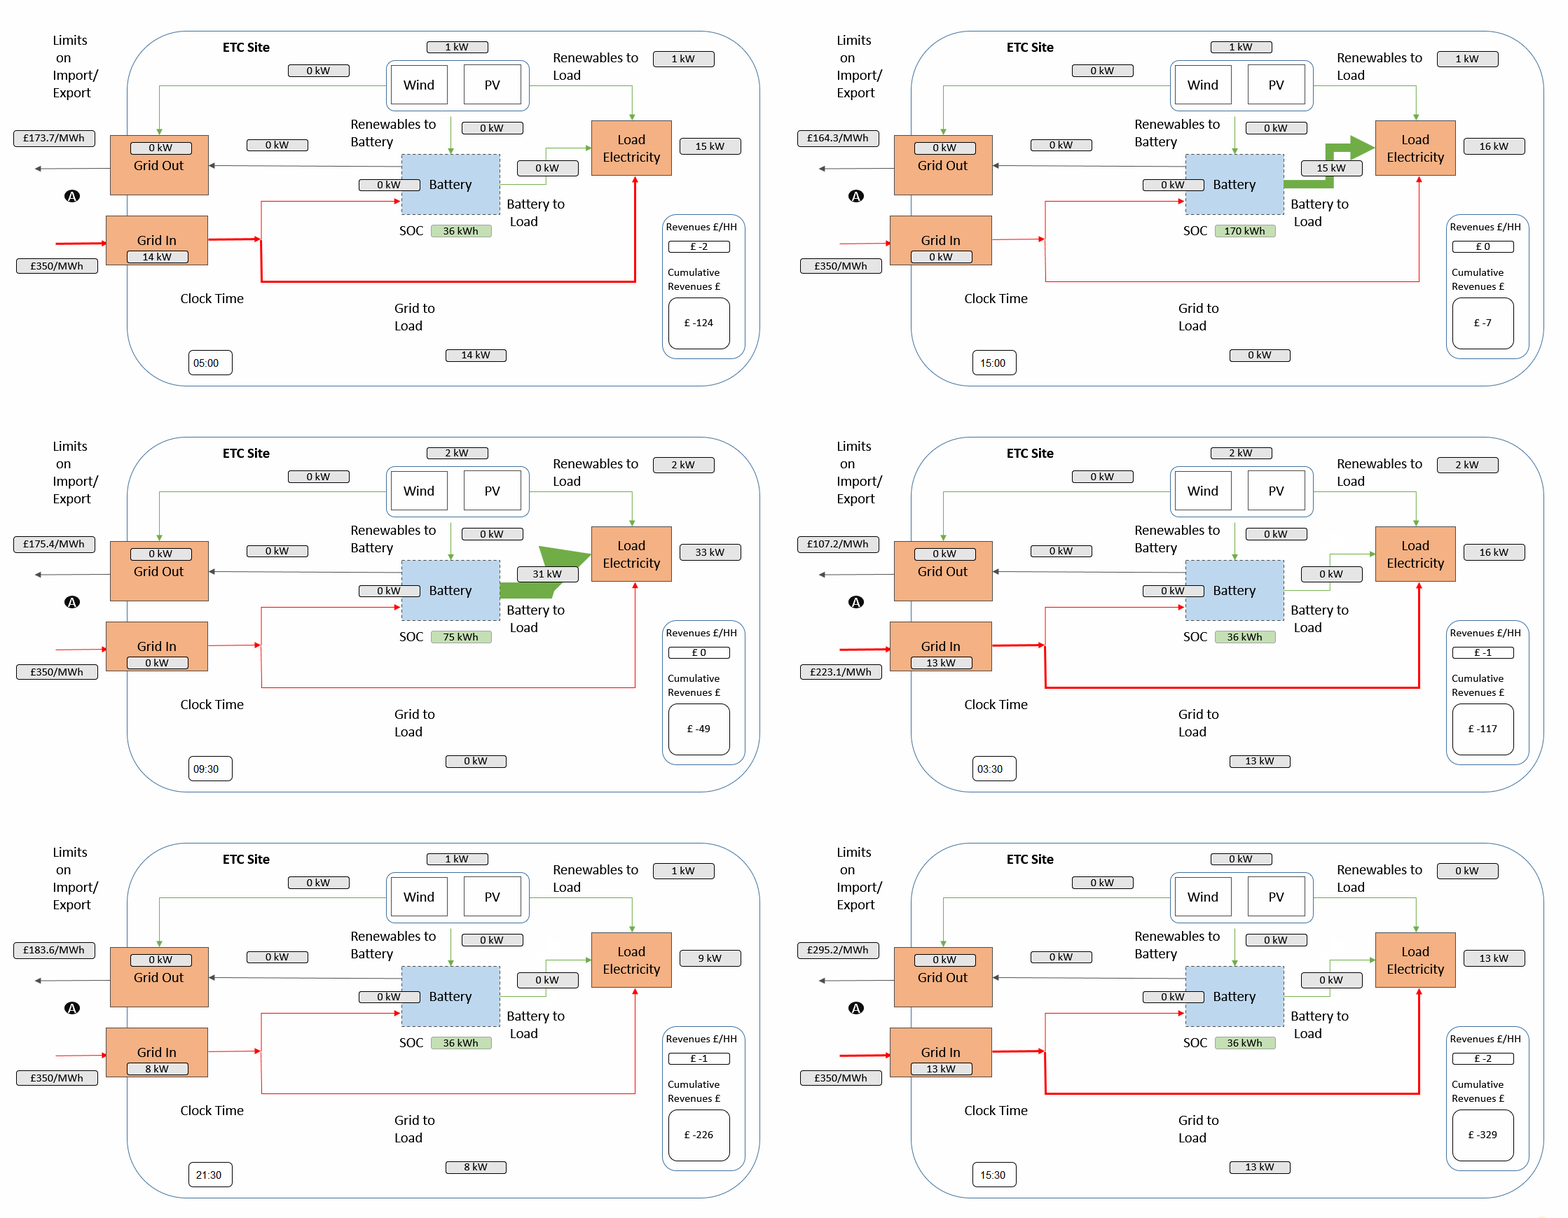
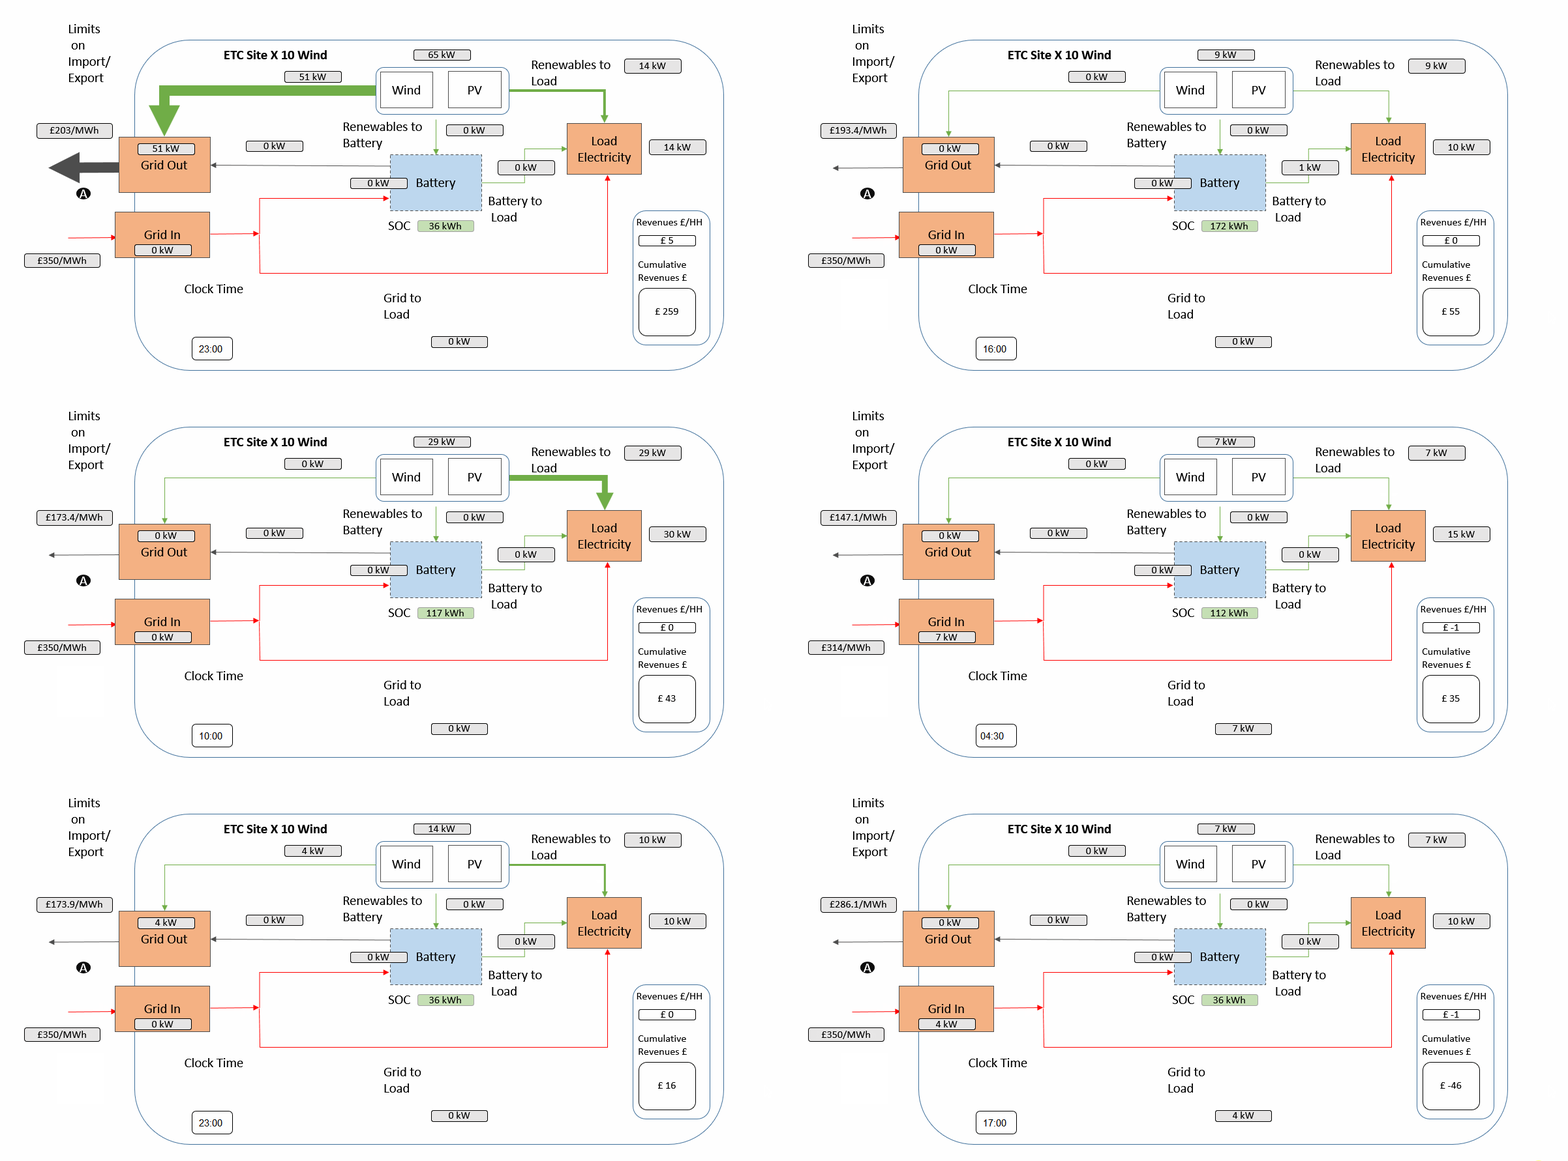
The video below conceptualises the current setup in block form and shows a simulation/animation of the assets described above. Arrow sizes represent flows associated with use case.
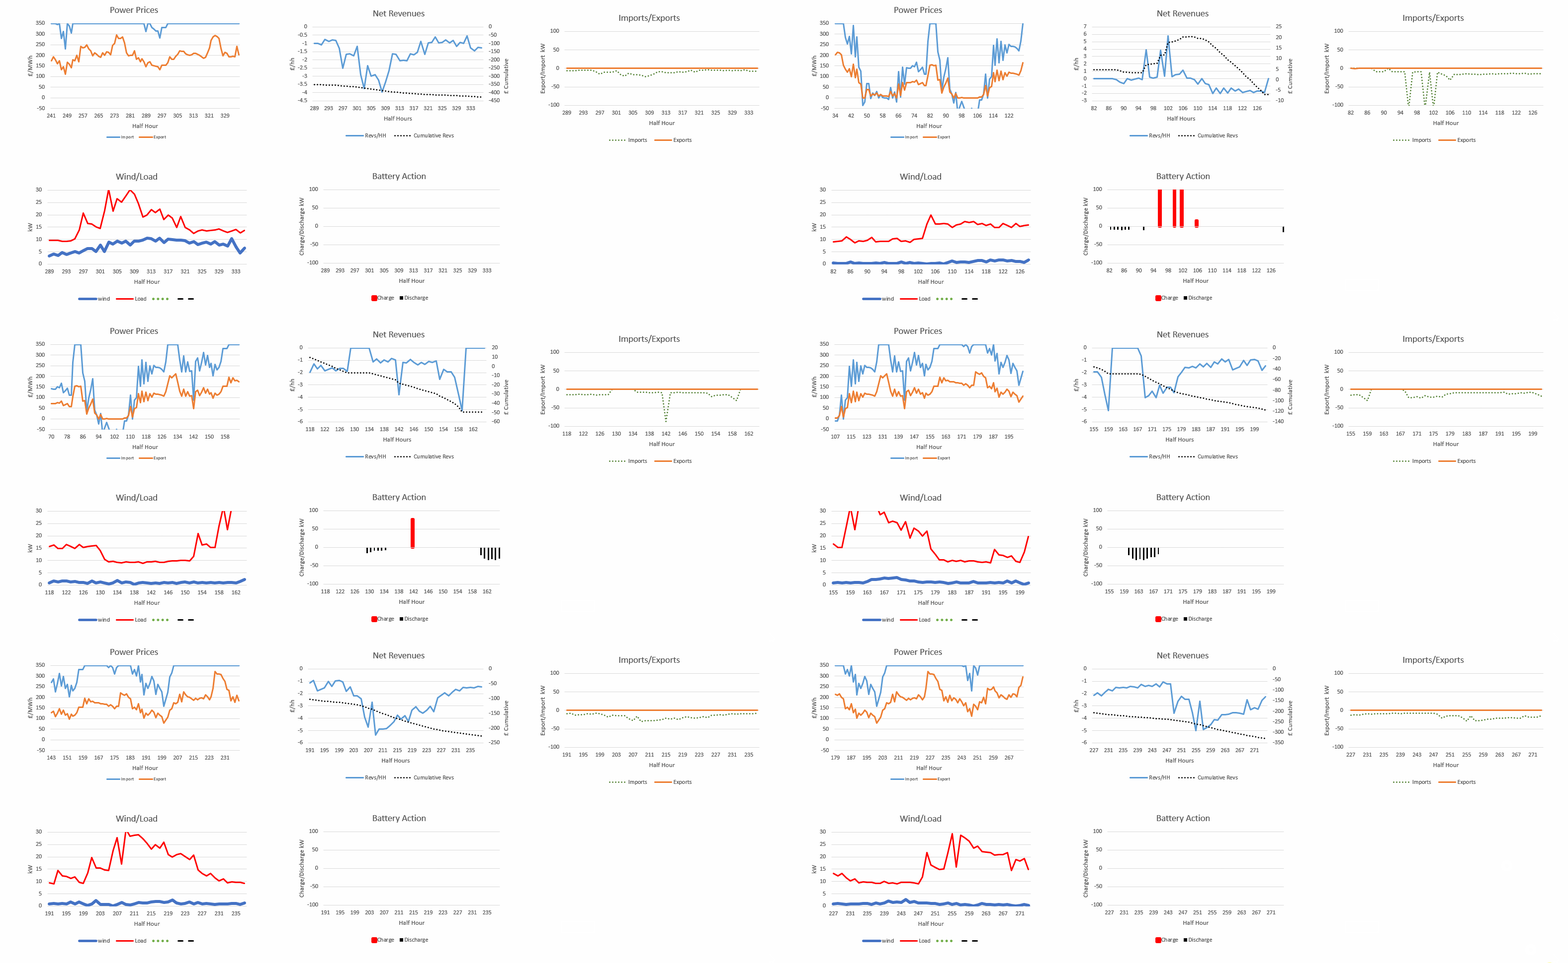
Two cases are shown below.- ETC with its current assets (Figures 1 & 2)
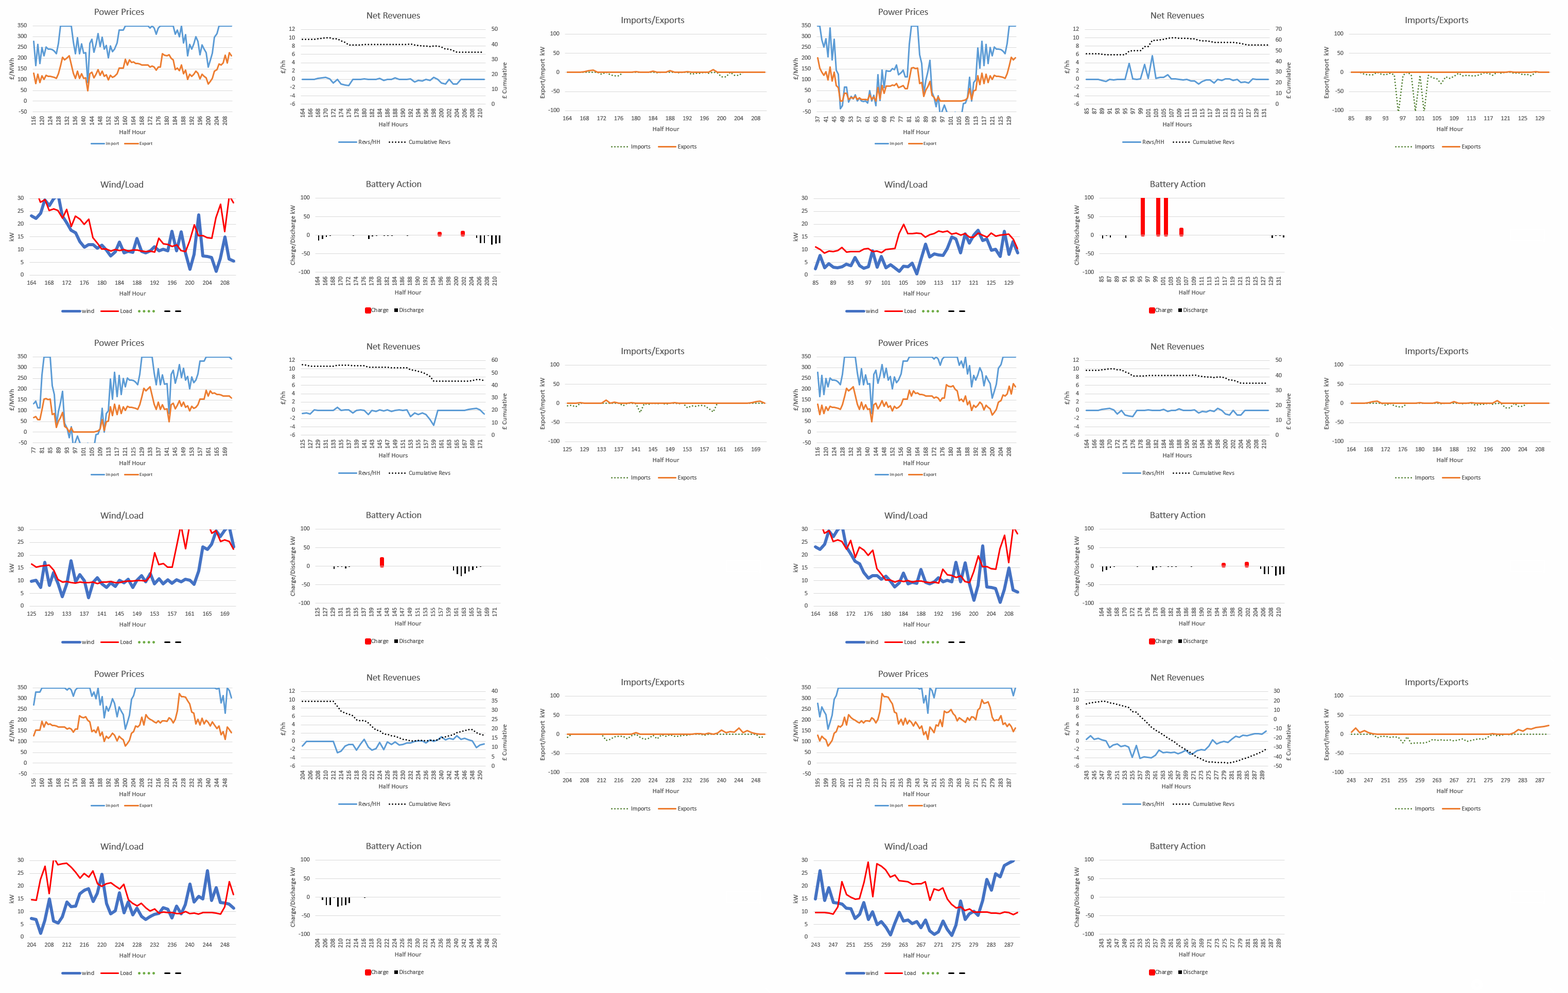
- ETC with 10 times the renewables (same assets Renewables - scaled - see Figures 3 & 4). Battery size and Load remains the same.
1. ETC Renewables - Base Case


2. ETC Renewables x 10


Notes
- Net Revenues = Export to grid Revenues - Import from Grid Revenues
- Simulation over one week; Half Hour by Half Hour. Sim start from HH -96
- Graphs show rolling window. Note the right hand side of the graph shows the latest output. Those to the left of that point represent the historical points
- Note zero flow lines still shown
Commentary
In the base case renewables are always sent to the Load first and is supplemented with battery output occasionally. Exports are minimal. Net Revenues (Exports - Imports) are -£515 over a week with the battery and -£632 without it. Scaling to a year, the battery with VPP control could therfore provide an additional potential revenue of around £6,100/year. The average battery SOC over the week is around 40%. Note revenues etc will be dependent upon price assumptions. Most of this net benefit arisies in the first 84 hours (~half a week) when import prices are not affected by the Octopus price cap. Without a price cap potential net benefits could be around £10,000 per year with this set up. In the case where there is 10 times the renewables with the same load more interesting behaviour occurs. Battery exports occur to supplement revenues and exports of the renewables occurs as the load is to small to accomadate all of its output. Note that the octopus import prices are some times negative, so one would expect that the algorithm would charge the battery at all times. This does not occur at all times, as the MPC algorithm uses a lookahead algorithm and decides on the best time to charge the battery to maximise revenues. Note that when prices are high the battery is discharged. The octopus prices are based on those seen in 2022 when peak prices were capped at £350/MWh.


